Polygraph
Polygraph is a studio composed of the same team behind The Pudding.We’re your favorite in-house data journalism team, with an eye for translating complex information into visual content.
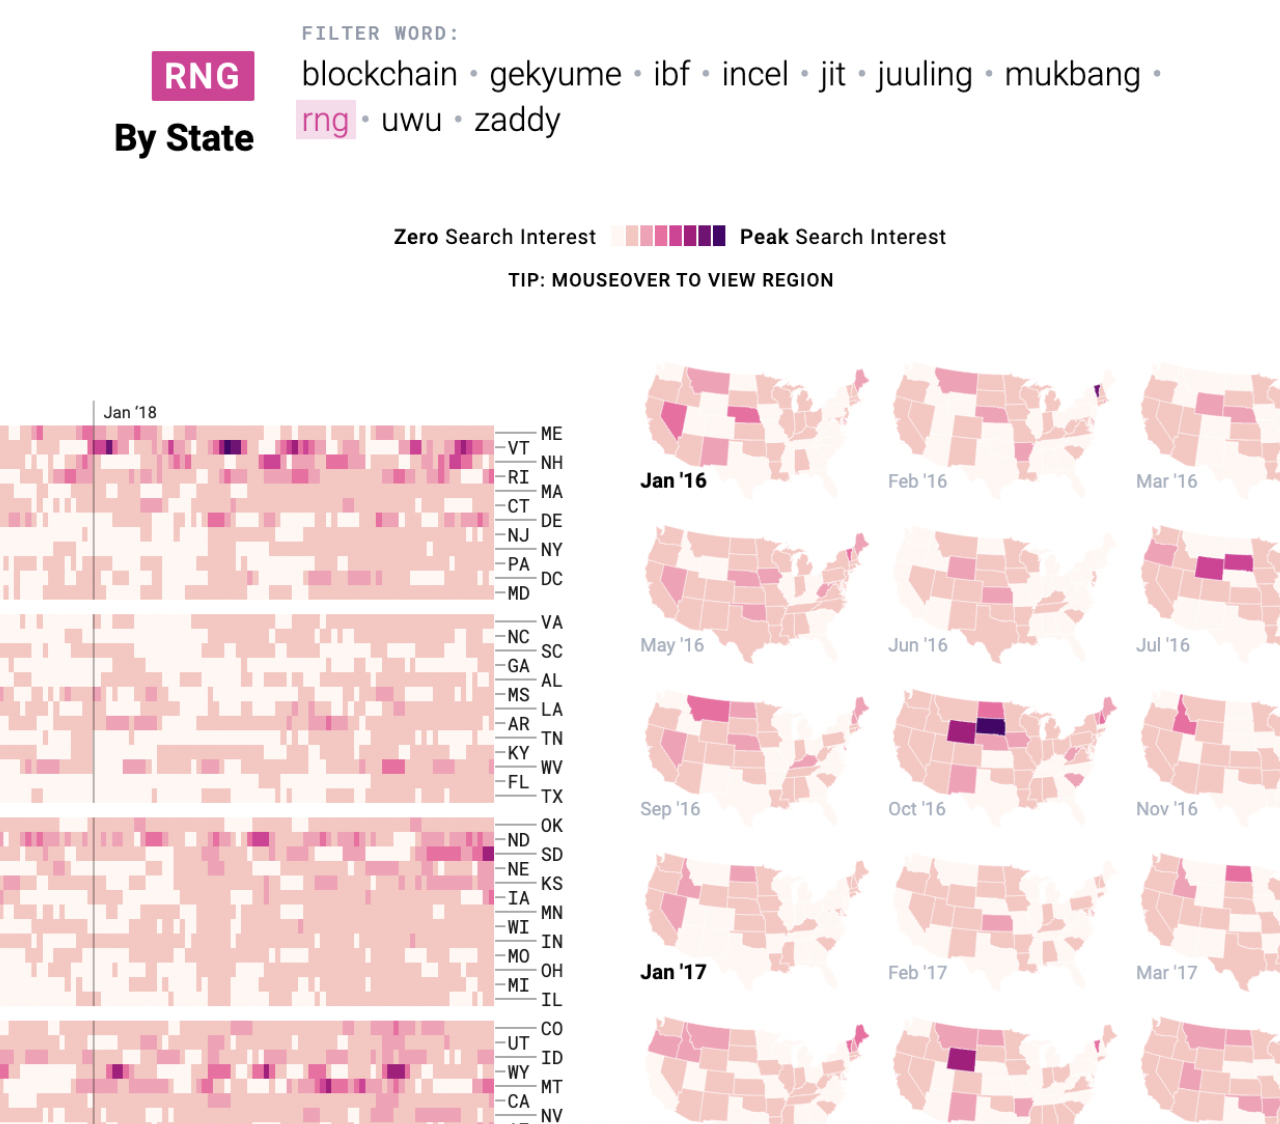
Google Trends
The Year in Language
We identified 2018’s rising words by ranking search interest growth for their definitions (e.g., searches for “woke definition,” “define woke”). This project was also the subject of an NBC video series.
Universal Music Group
Lobby Visualization
Universal Music Group wanted to highlight their artists' global reach by showcasing their impressive data catalog, so we created a real-time visualization for the lobby of their headquarters and other offices around the world.
The Washington Post, Google News Initiative
Reconstructing seven days of protests
In May 2020, a recording of George Floyd's death ignited a week-long protest in Minneapolis, which escalated into a summer of historic demonstrations across the country. Polygraph partnered with Google and The Washington Post to create a project visualizing these protests.
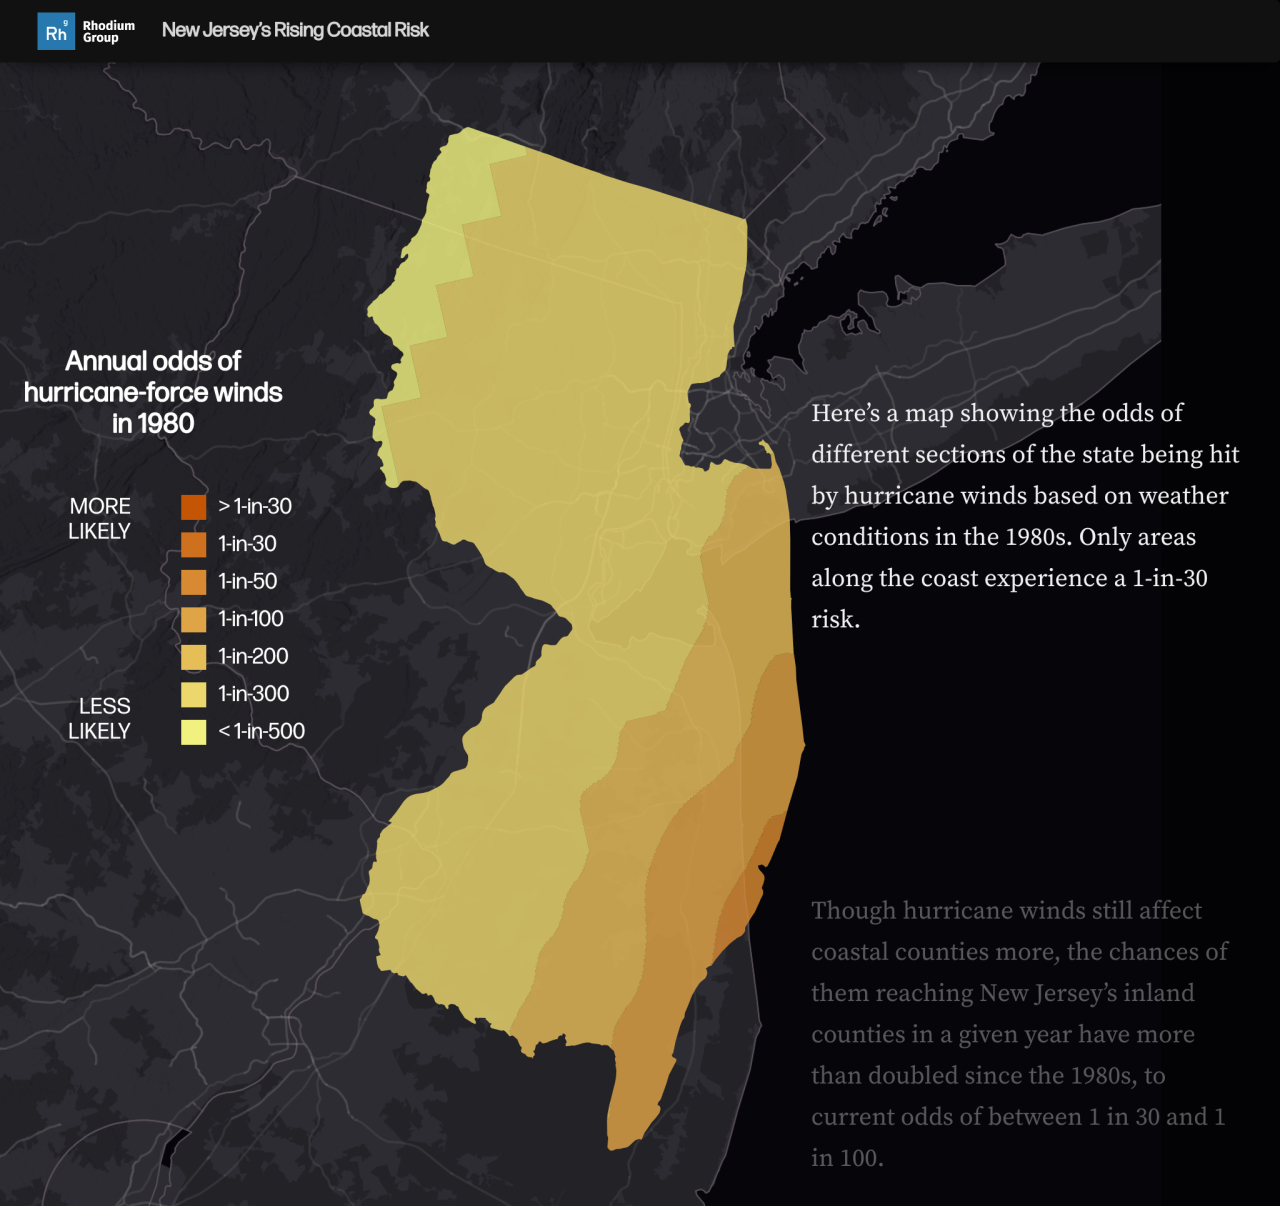
Climate Impact Lab, Rhodium Group
New Jersey Coastal Risk
We collaborated with the Climate Impact Lab to analyze Rhodium Group’s groundbreaking climate research and create an editorially driven, standalone microsite explaining the impact of flooding in New Jersey.
YouTube
Data Vids
In 2022, YouTube began implementing its own version of Google Doodles. We utilized their unique data to identify trends and presented them in a fresh format that resembles an article from The Pudding, condensed into a short, informative video.
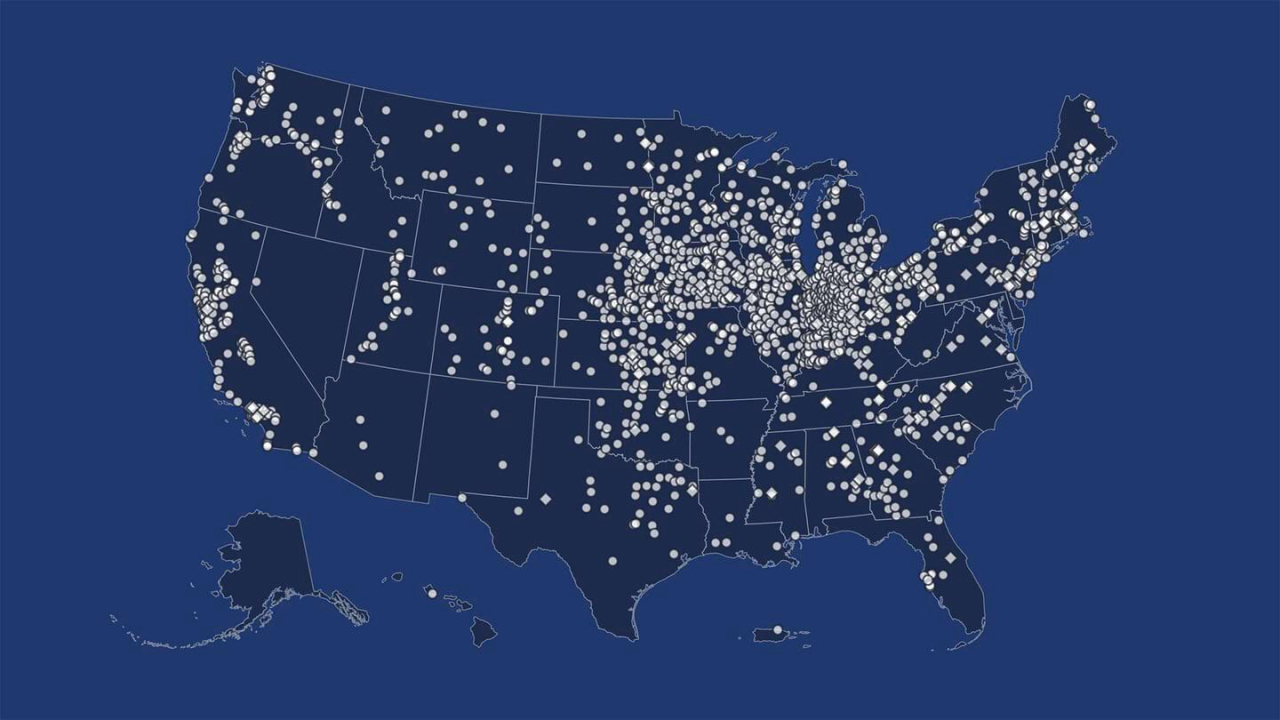
Carnegie Corporation of New York
Carnegie Libraries Across America
In 2025, we worked with the Carnegie Corporation of America to digitize and visualize the authoritative document on Carnegie Libaries, a 1963 report detailing the funding of more than 1,700 libraries across the United States.
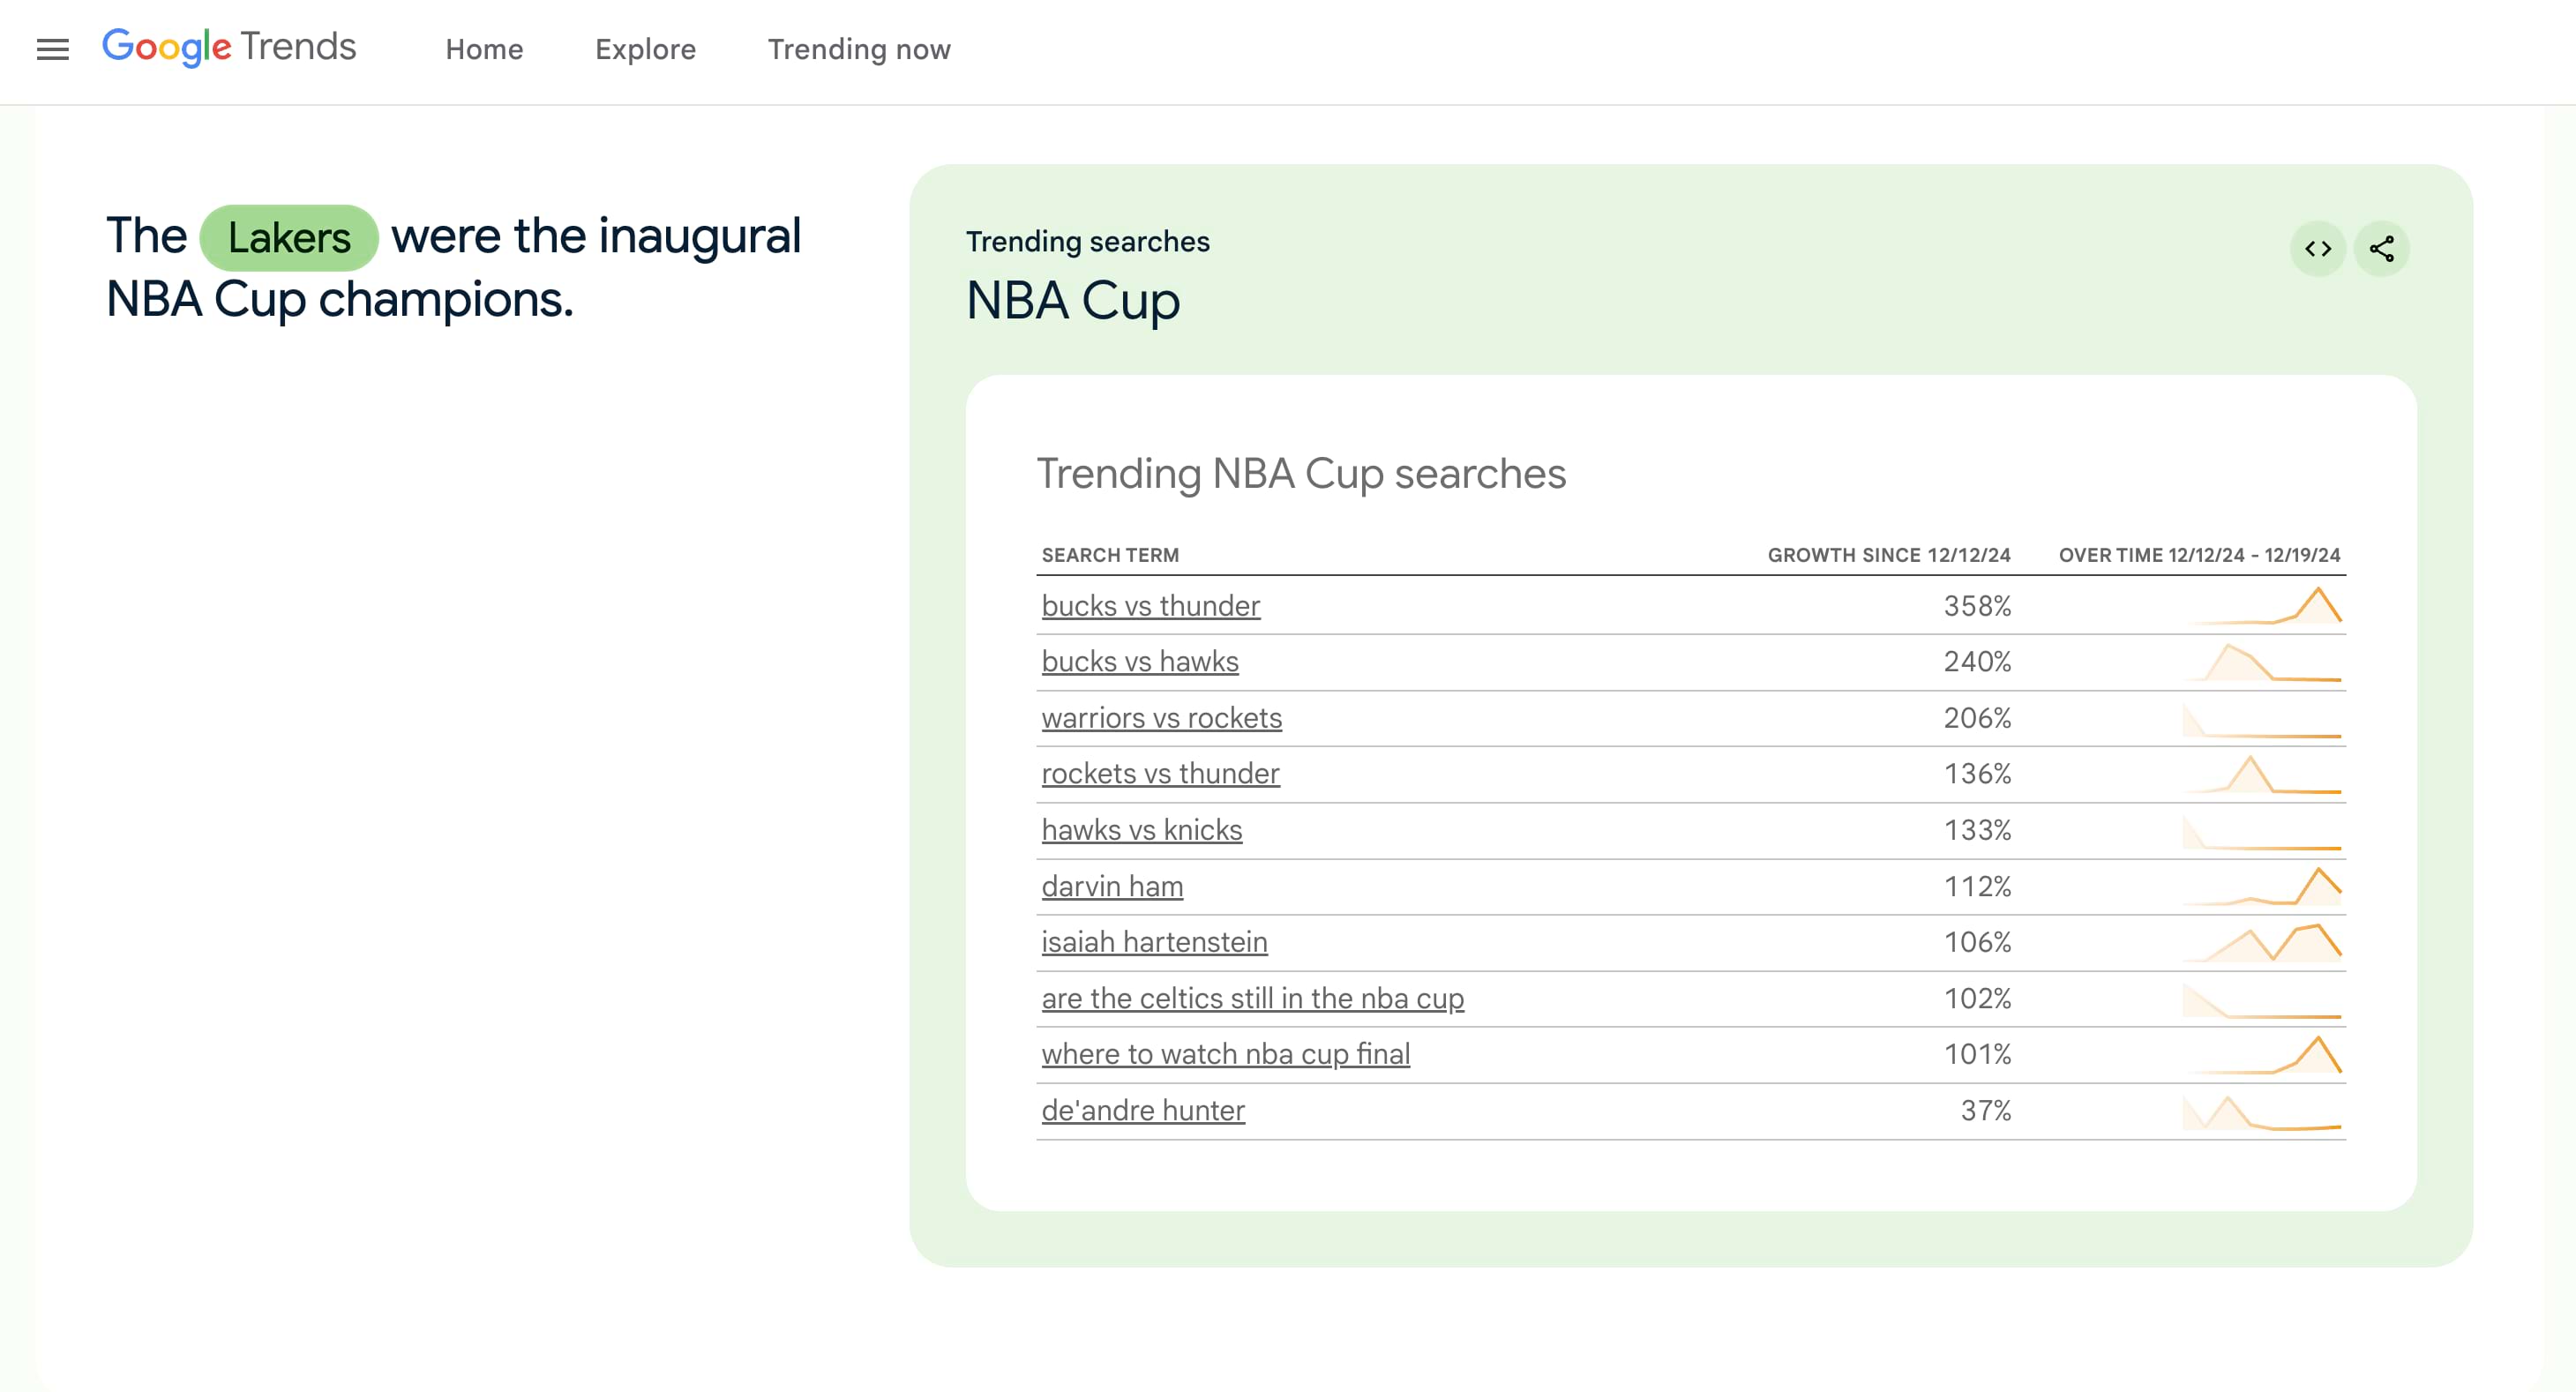
Google Trends
Google Trends Data Visualization
In 2024, we built interactive charts for Google Trends' story pages, including 2024's Year in Search and Climate Trends Over Time.
Economic Graph Research
Since 2020, we have transformed the LinkedIn Economic Graph Research Institute's powerful data science research into a series of five digestible visual essays for policymakers and users.
Google Trends
World Cup Shorts
Using search data about players, teams, and matches, we collaborated with Google Trends during the 2024 Women's World Cup to produce a real-time, short-form series recapping major moments from the tournament.
NHPR Document
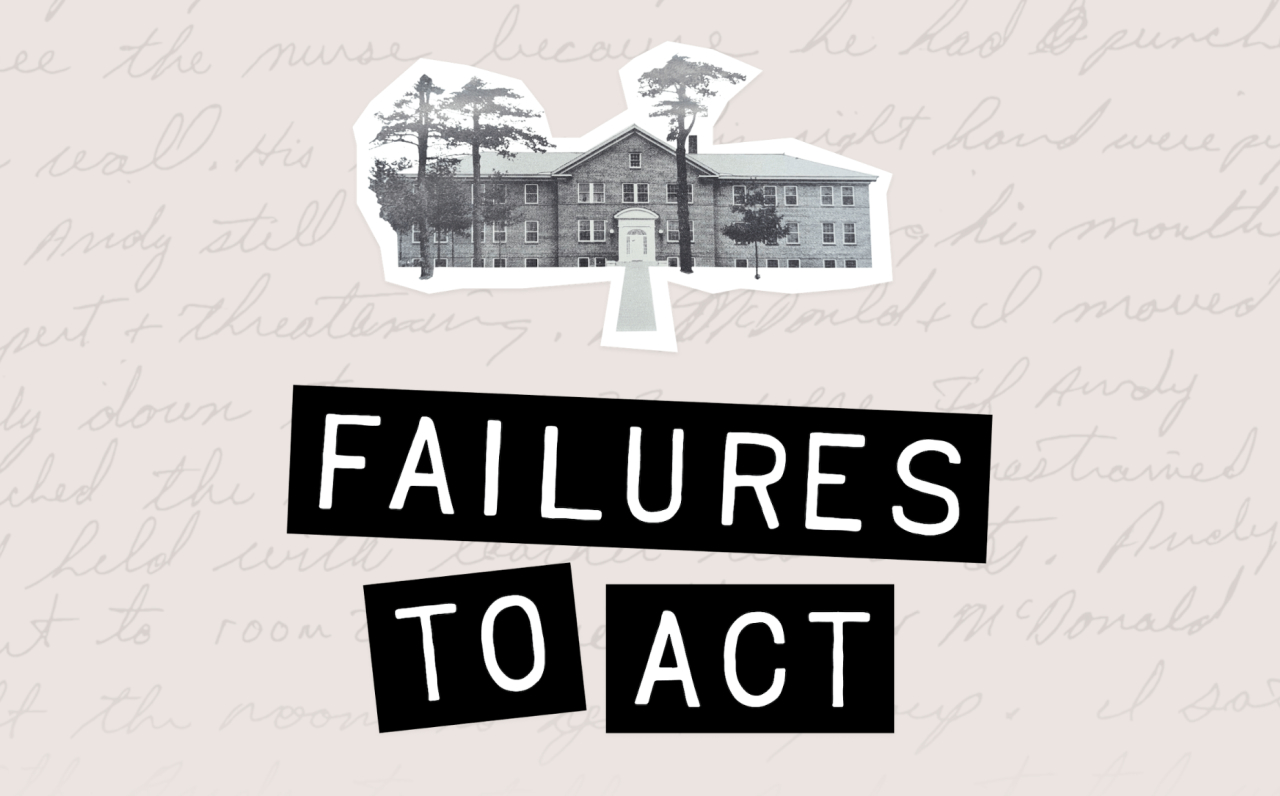
Failures to Act
We partnered with NHPR's investigative team, Document, to analyze 1,281 court documents related to alleged child abuse at New Hampshire's youth facilities. Explore the staggering scale and detail of one of the largest youth detention abuse scandals in American history.
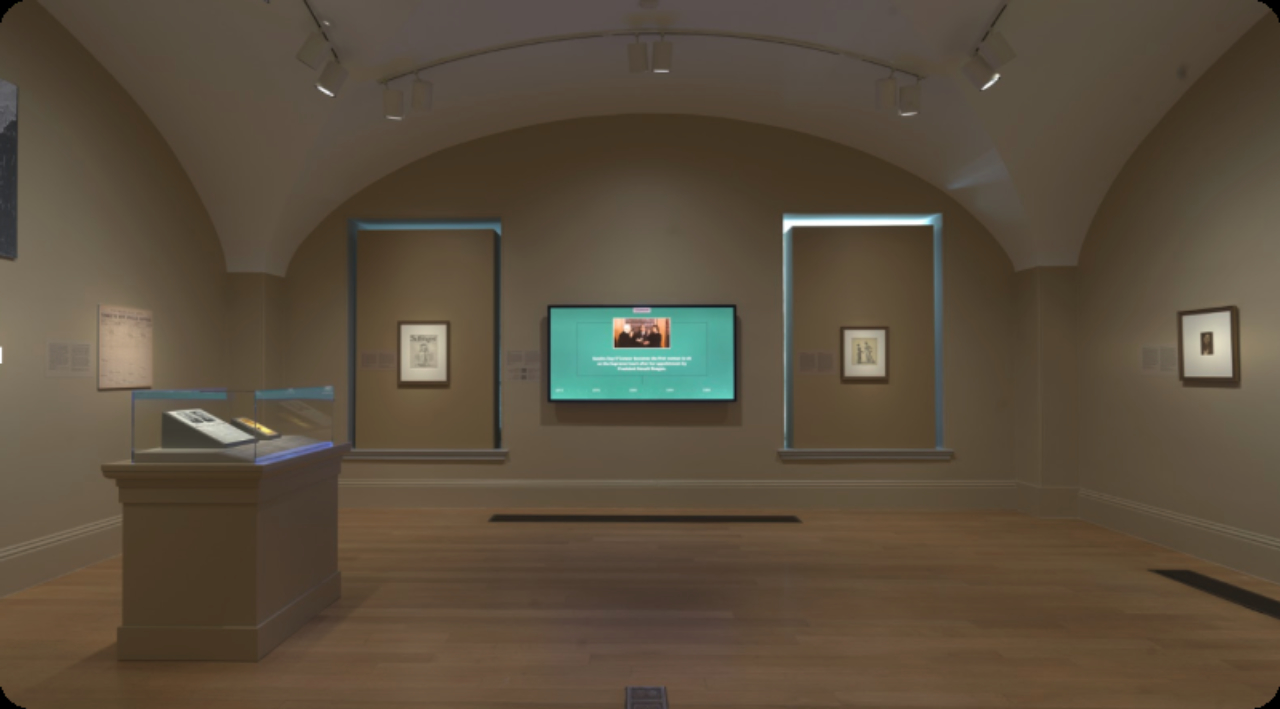
Smithsonian National Portrait Gallery
Votes for Women
Our first physical installation, The Pudding's breakdown of women's issues within political party platforms was featured in the Smithsonian National Portrait Gallery's Women's Suffrage exhibit in 2019.
Sirius XM Media
Explore the Podcast Universe
After SiriusXM expanded its podcast offerings, they asked us to create an innovative tool—primarily for the sales department—to highlight their catalog and listener demographics.
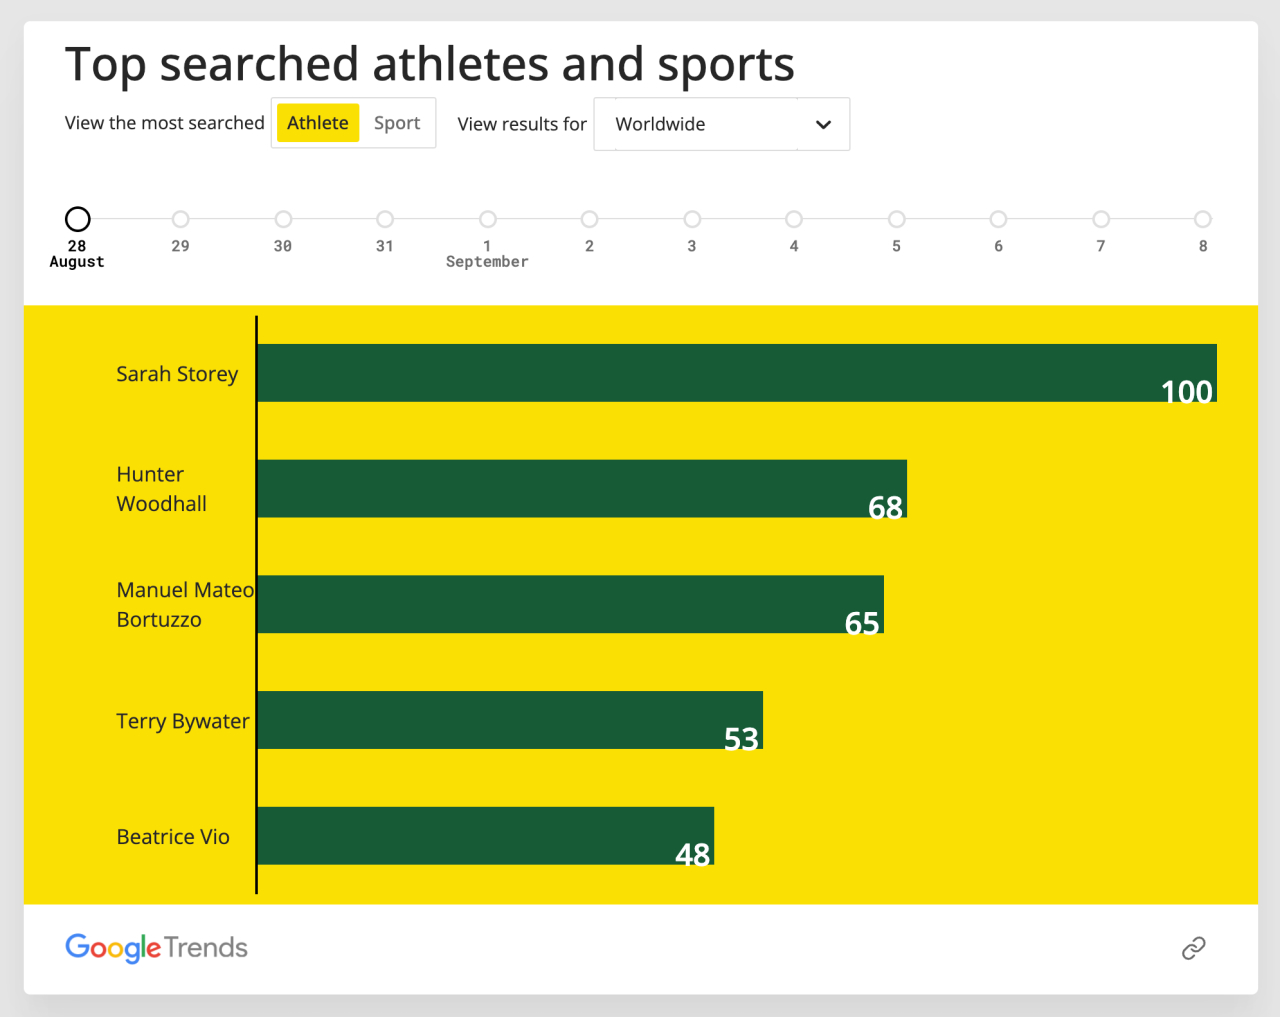
Google Trends
Paralympics (2024)
We visualized daily search insights related to the 2024 Paralympics throughout the games, featuring an automatic data pipeline in the backend, custom icons, and an updated version of the Alternative Medals Table.
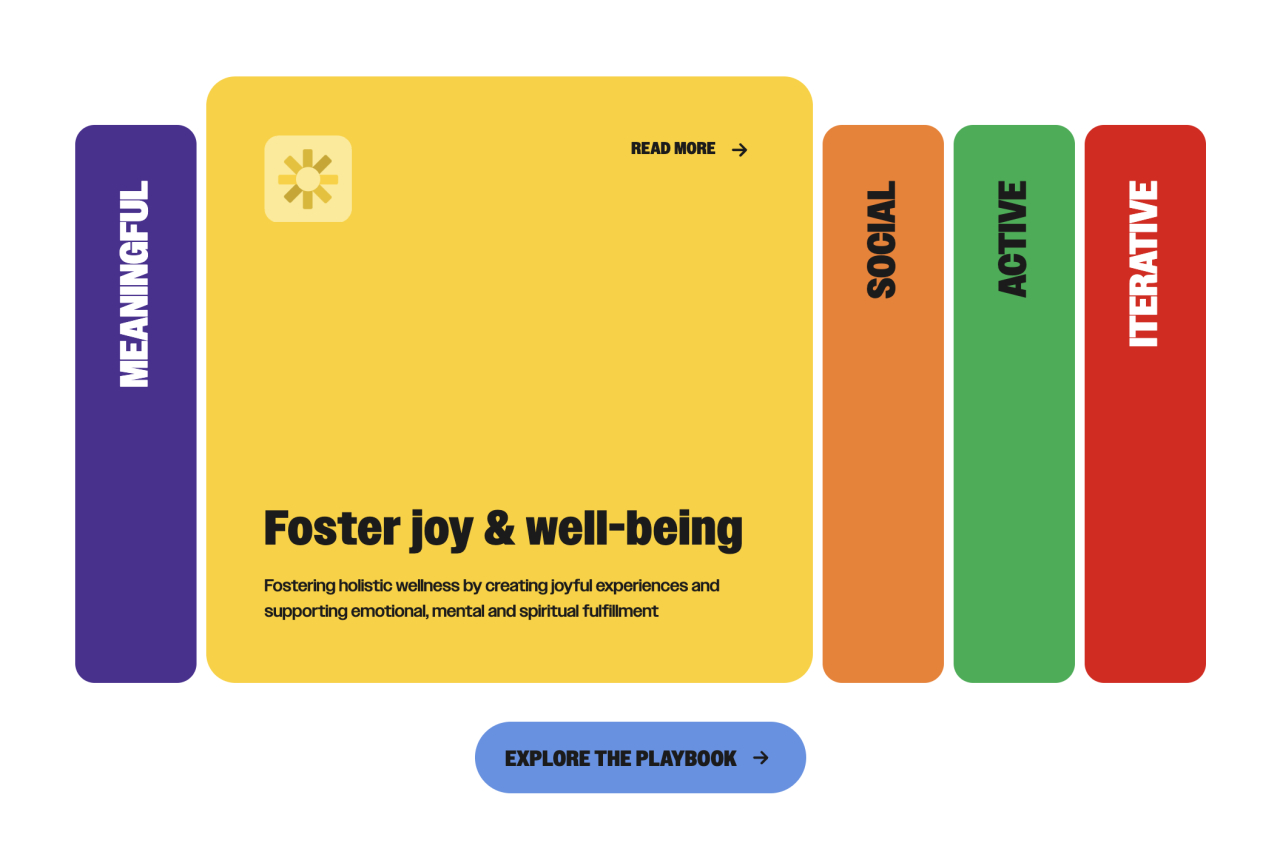
Principles for Responsible Management Education (PRME), United Nations, The DataFace
i5 Platform
In partnership with The DataFace, we analyzed United Nations / PRME's rigorous i5 curriculum and created a digital playbook for members to teach in their institutions.
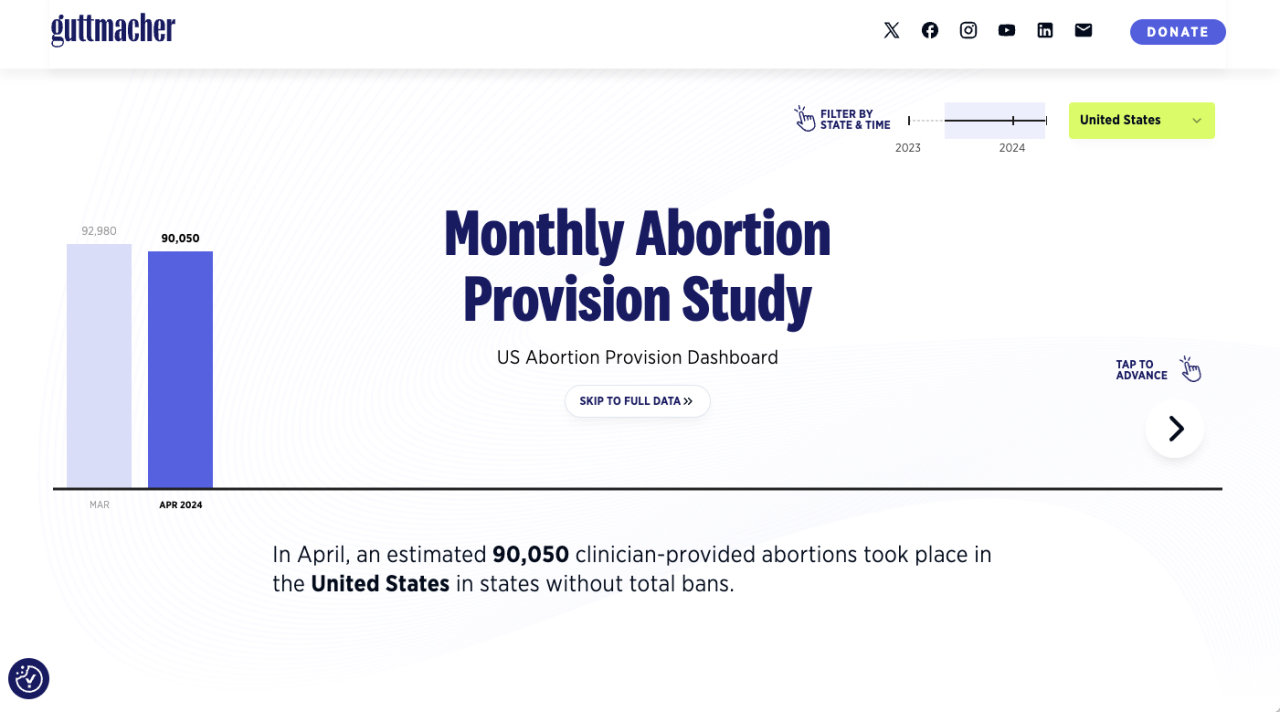
Guttmacher Institute
Monthly Abortion Provision Study
We worked with the Guttmacher Institute to reimagine their Monthly Abortion Provision Study dashboard, merging an interactive narrative with a regularly updating dashboard of regional abortion data.
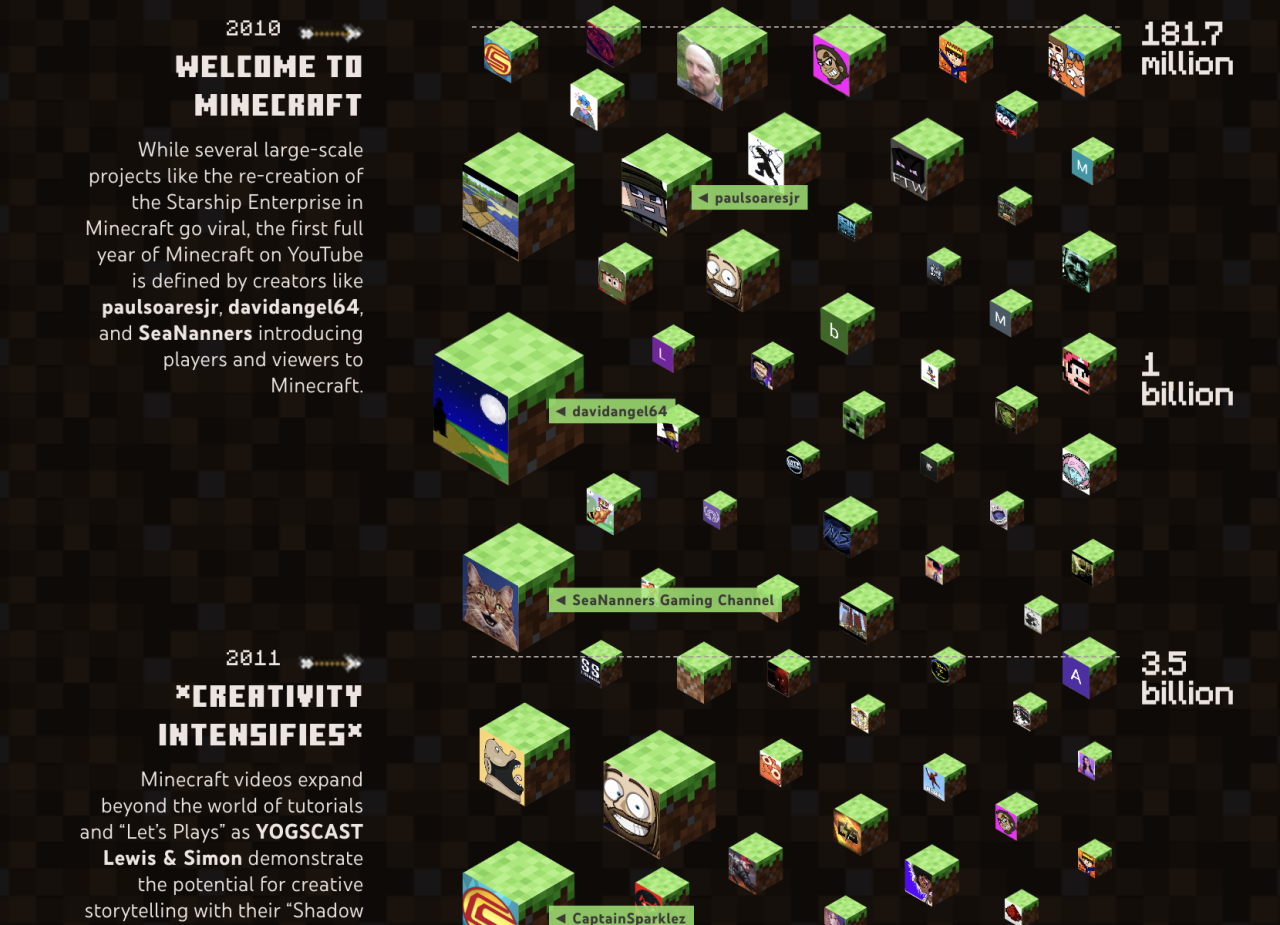
YouTube Culture and Trends
One Trillion Minecraft Views
Minecraft became the first topic to hit one trillion views on YouTube. To celebrate, we collaborated with longtime partners Culture & Trends to create a unique experience commemorating the milestone, the game's 10th anniversary, and the creators and videos fueling its popularity.
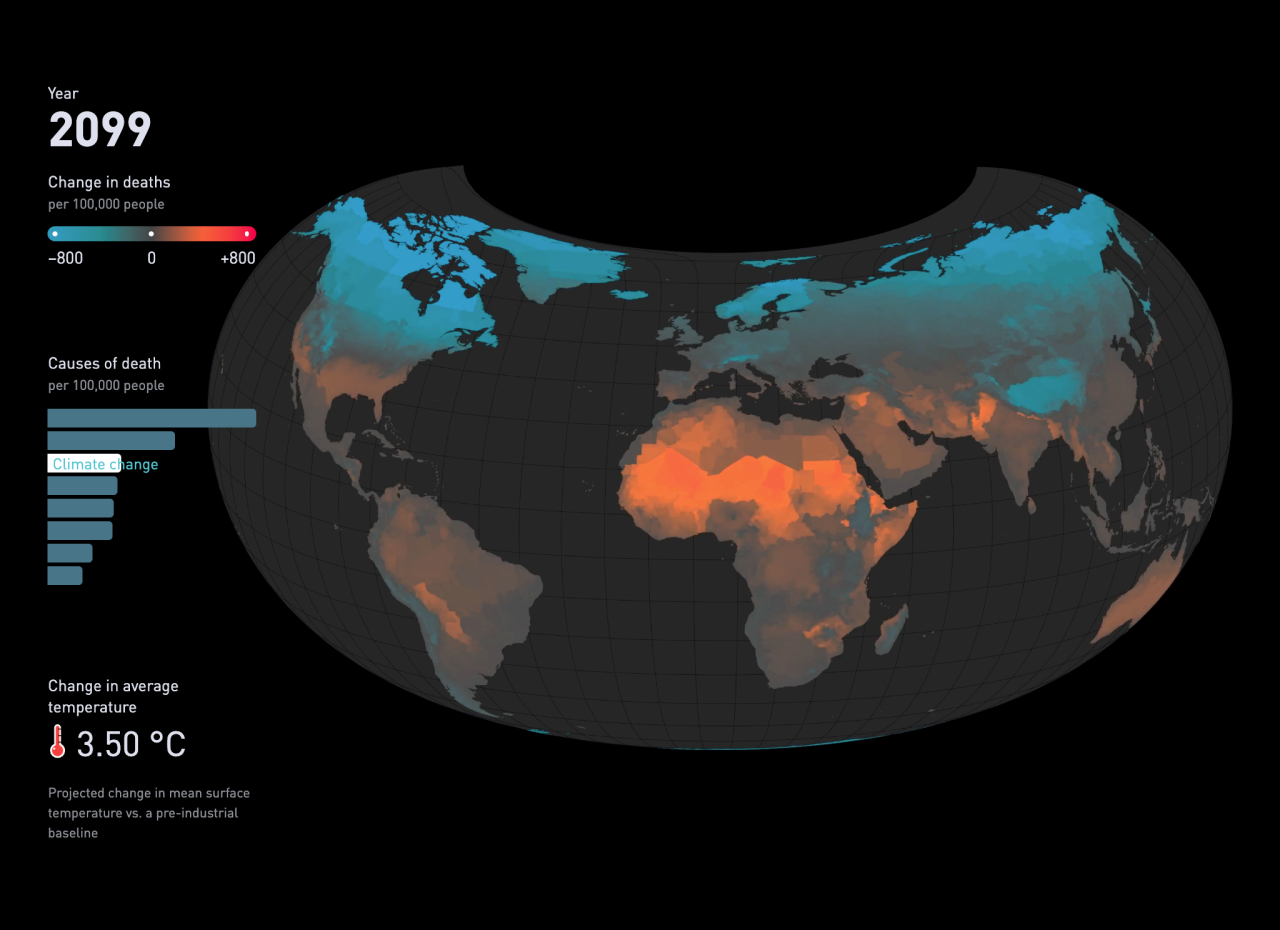
Climate Impact Lab, Rhodium Group
Lives Saved Calculator
In our second collaboration with the Climate Impact Lab and Rhodium Group, we translated new research from a PDF into an impactful experience that visualizes the projected effects of rising heat on global death rates.
USA Today, Democracy Fund, UCLA
Nationscape Insights
We analyzed a dataset of over 6,000 Americans surveyed in the weeks leading up to and following the 2020 election, displaying the results in a clear and organized dashboard of election issues, broken down by region, topic, and political leaning.
Harvard University, Harvard Kennedy School
Social Policy Lab Stories
We built a comprehensive data storytelling platform for the Kennedy School, featuring a scalable CMS and innovative layering of complex information to make Harvard's academic research more accessible to policymakers and the general public.
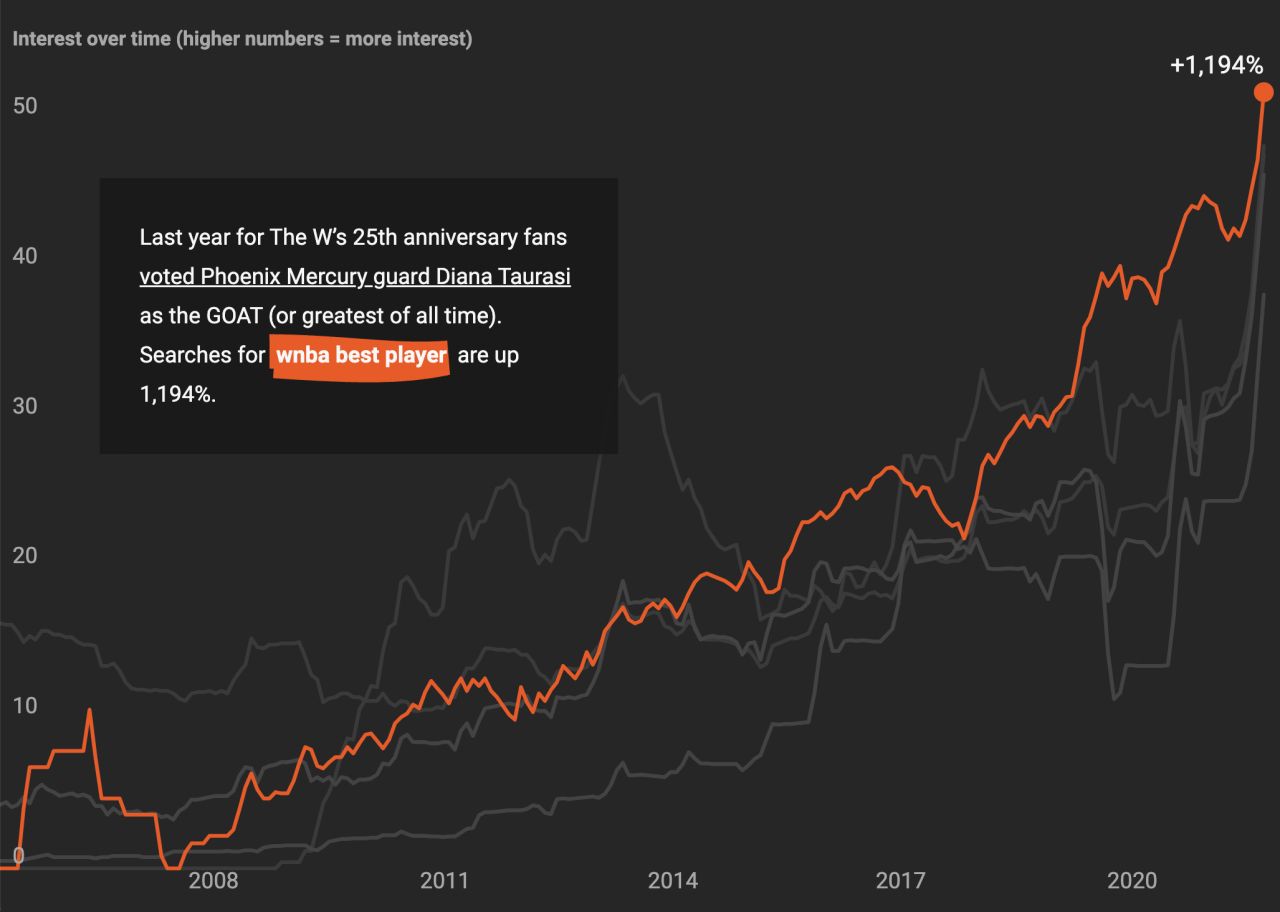
Google Trends
WNBA Firsts
Marking the 50th anniversary of Title IX with Google Trends, we celebrated monumental figures in the WNBA brought to life through search data.
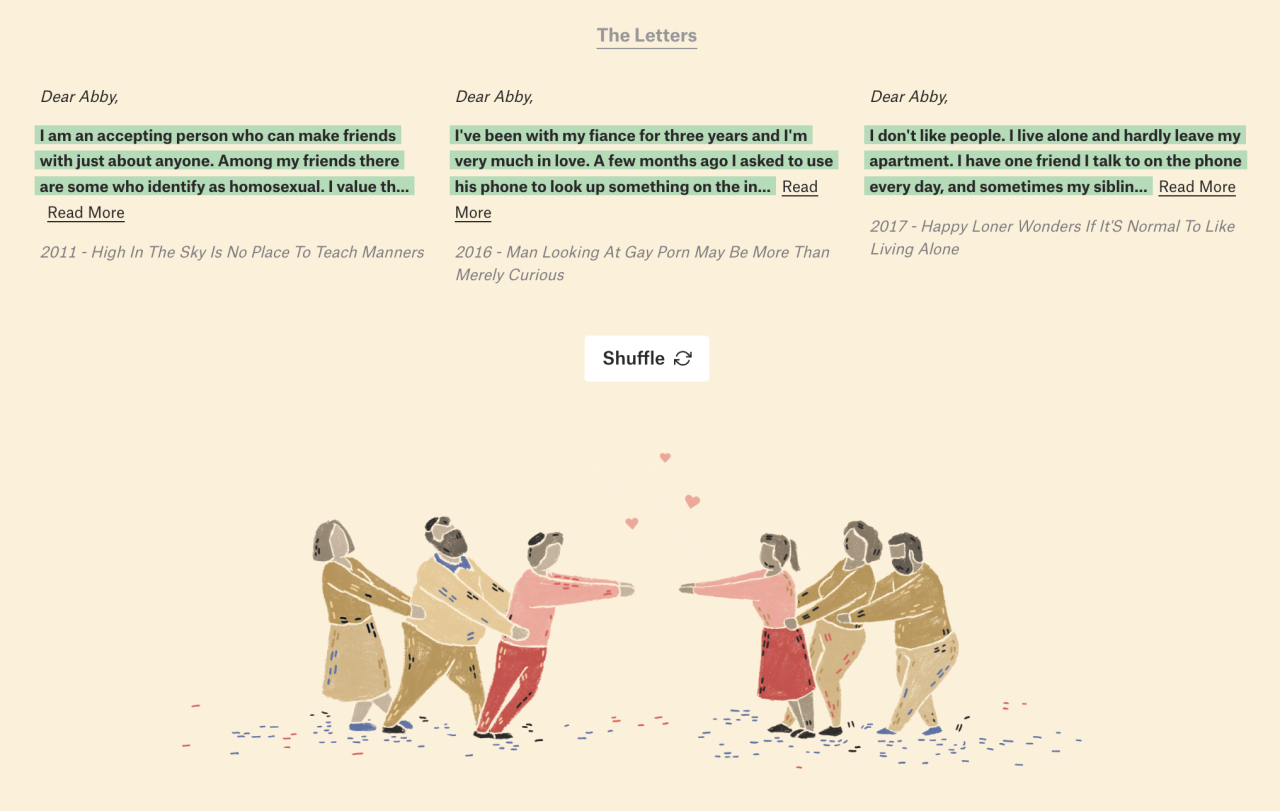
IBM
30 Years of American Anxieties
Using IBM Watson, we analyzed decades of Dear Abby advice column letters to produce a comprehensive visual analysis of what Americans worried about over the years.
All Other Work
2024
- The Great Transfer-mation — EIG / Periscopic
- The Media Bias Detector — University of Pennsylvannia
- Olympics (2024) — Google Trends
- Weavers: Social Trust — The Aspen Insitute
- ROI Calculator — LinkedIn Sales Solutions
2023
- 2023 Creator Report — Linktree
- How Russia’s invasion transformed one Ukrainian city — Vox, Google Trends
- The 2023 IPCC Report — Earth Alliance
- Time Capsule — Google Trends
- Women's World Cup (2023) — Google Trends
- Year on YouTube 2023 — YouTube Culture and Trends
- YouTube #1 Streaming Service (2024) — YouTube Ad Marketing
- Skills First Report — LinkedIn
2022
- Data Vids: Billion Views Club — YouTube Culture and Trends
- Data Vids: Speedruns — YouTube Culture and Trends
- Data Vids: Sneakers — YouTube Culture and Trends
- Data Vids: EOY Breakout Creators — YouTube Culture and Trends
- Year on YouTube (2022) — YouTube Culture and Trends
- Gender Equity — LinkedIn
- Men's World Cup (2022) — Google Trends
2021
- Hey Guys — YouTube Culture and Trends
- The Rise of Aesthetics — YouTube Culture and Trends
- Year on YouTube (2021) — YouTube Culture and Trends
- Lockdown Hobbies — Google Trends
- LGBTQ+ Language Glossary — Google Trends, VideoOut
- Green Economy — LinkedIn
- Future of Skills — LinkedIn
- Olympics Alternative Medals Table (2021) — Google Trends
- NYC (2021) — Enigma
2020
- Flooding — USA Today
- The Common Knowledge Project — Google News Initiative
- State of the Union (2020) — Google Trends
- Career Explorer — LinkedIn
- Watching the Pandemic — YouTube Culture and Trends
2019
- Rewind 2019 — YouTube Culture and Trends
- "With Me" — YouTube Culture and Trends
- Mapping Thanksgiving — Google Maps
- Emoting with Pop Culture — Google Trends, Tenor GIFs
- NBC Slang Series — Google Trends
2018
- The Diversity of Newsrooms — Google News Initiative, American Society of News Editors (ASNE)
- The Platinum Patients — The Atlantic
- Transcending Oil — Elemental Excelerator, Emerson Collective
- What is the Pizza Capital of the US? — Google Trends
- Oscars (2018) — Google Trends
- Thanksgiving Trends (2018) — YouTube Culture and Trends
- Holiday Travel (2018) — Google Flights
- World Cup (2018) — Google Trends
- State of the Union (2018) — Google Trends
- YouTube's Most-Viewed Video (2018) — YouTube Culture and Trends
2017
- Crowdsourcing the Definition of Punk — Converse
- Music Maps — YouTube Culture and Trends, The New York Times
- The Most-Watched NBA Moments, by Decade — Google Trends
- Fan Theory — Viacom
- Creative Communities, by City — Kickstarter
- The Universe of Miles Davis — Sony
- Oscars Maps (2017) — Google Trends
- News Nerd Survey — OpenNews, Google Trends
- The Digital Skill Set — International Center for Journalists, Google News Initiative